The project explores how community satellites and D.I.Y. aerial balloon mapping techniques developed by The Public Lab could be used by women in Uganda to create a rival map to that of the government and challenge their imminent eviction from a site they used as a market place.

The Context
In 2013 I was interested in better understanding modes of women’s economic empowerment in Kampala, Uganda as part of my graduate studies enabled through UNICEF’s Innovation Lab. The research, but most importantly, the experiences of my collaborators and my own lived experiences informed two projects: Tools for Stalling and Change for Social Design.
UNICEF Uganda received a grant from Barclays Bank to build an evidence-based entrepreneurship program that would provide young girls with a practical and effective model to support their livelihoods. To do so, UNICEF Uganda wanted to model their program after BRAC’s model of financial literacy. BRAC, an international development organization based in Bangladesh, seeks to empower girls through entrepreneurship, teaching them to skills to make crafts and farm. These trades dependent are somewhat dependent on continuous access to land, whether to retrieve raw materials for the crafts or to raise livestock. However, women are often marginalizing by customary and government officiated modes of land tenure.
Due to the organic nature of the insights uncover and the eviction process faced by my collaborators, the Craft Market (pseudonym), the project blossom to focus and explored how applied speculative design and D.I.Y. aerial balloon mapping techniques developed by The Public Laboratory could be used to measure a pulse using delight and challenge the Women’s market imminent eviction from a site they used as a market place.
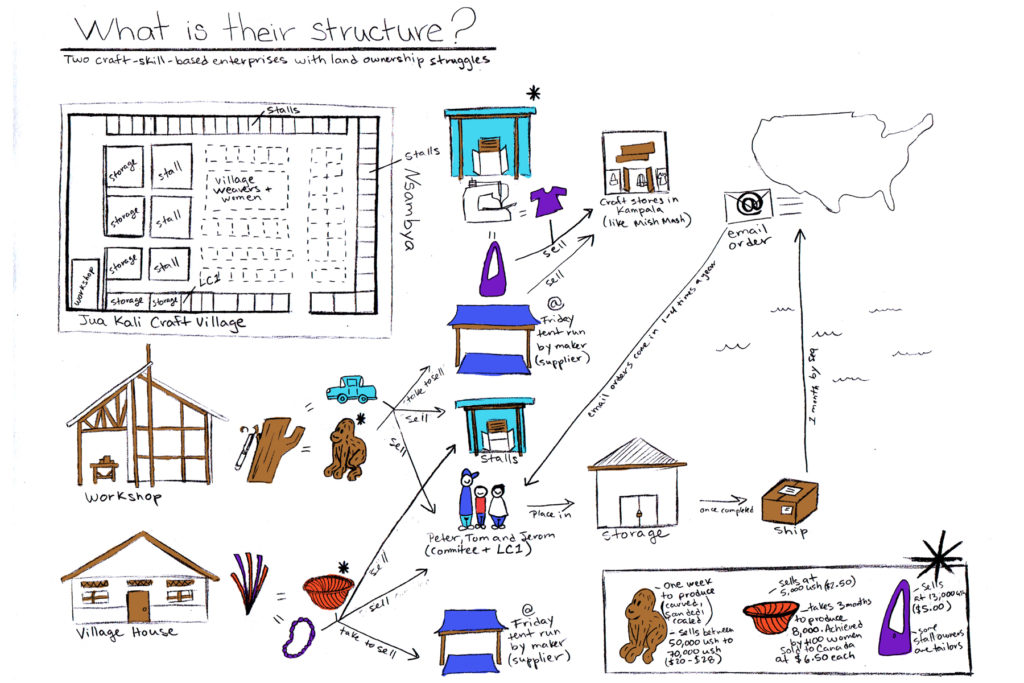
Market operations – Diagram Oct 2012 
24 hr photo diary – why the market is important to you? 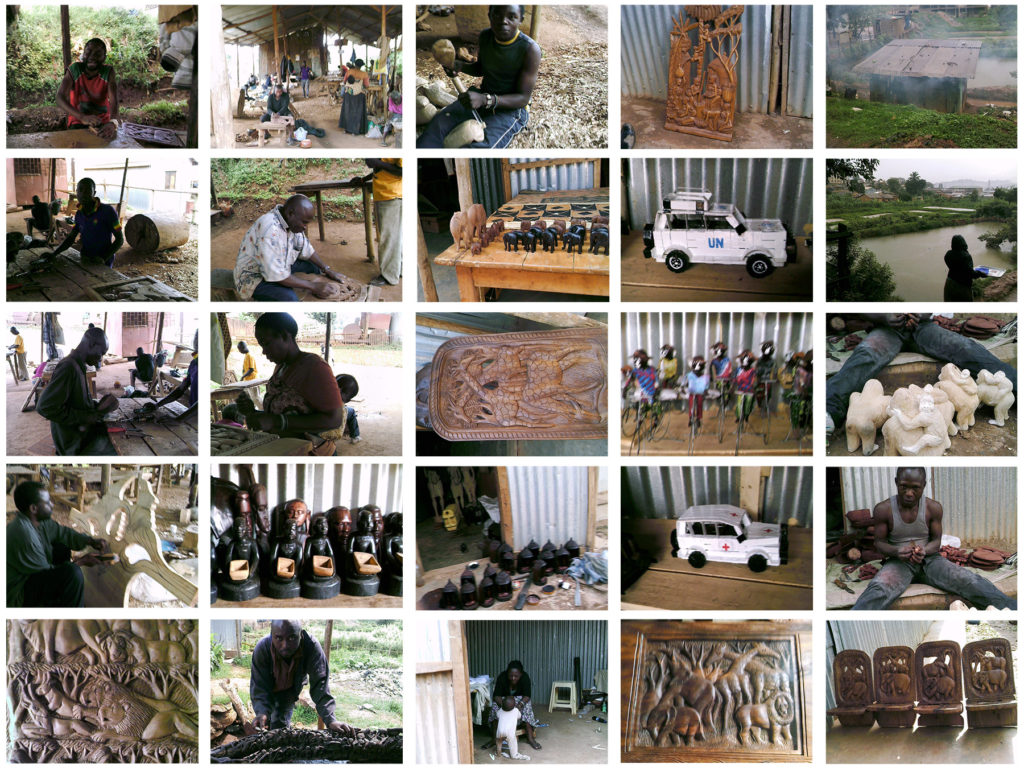
24 hr photo diary – why the market is important to you?
If maps are an apparatus of state control over a territory, how then are maps best used by communities to represent themselves?
Maps historically have been used as instruments of the state. Denis Wood in the Introduction to Rethinking the Power of Maps states the work of maps is to apply through state authority social force to people and so bring into being a socialized space. By linking things in space to define and shape the perception of people, the state use maps to make propositions about a territory and thus reduce the necessity of armed forces to assert its authority (Wood).
In the same book Denis Wood, in the chapter Counter Mapping and the Death of Cartography mentions most maps are accepted as unproblematic pictures of the real, however; presently in the 21st century maps are being rejected with more frequently then ever before. This coincides with the emergence of the culture of counter-mapping and the new attitudes of its practitioners who are taking maps and mapmaking in a whole new direction: “While the hype focuses our attention on the new technologies with their satellites, their gazillion miles of optical fiber, their computer hardware, and their miraculous software (that is, on their extraordinary capitalization), it’s the new attitudes, visions, and radical philosophies of the counter-mappers that are really taking maps and mapmaking in a whole new direction, a direction with the potential to free maps at last from the tyranny of the state” (Wood).
Through counter-mapping, communities hijack cartography to make themselves visible and more difficult to dismiss by using the representational values (like photographic maps) power structures like state and companies can relate to.
Using these principles, the Women’s Market and I collaborated to build a map that would serve to stall their eviction by the state and provide an alternative to how foreign companies like Google are representing the village.
‘The women’s market’ was located in Nsambya, a slum area near downtown Kampala, Uganda. The market was composed of 40 lock-up aluminum stalls around a middle courtyard. On Fridays, women suppliers would set up tents and sell their hand made goods in the middle court. Kalyesubula in the article Earning a Living from Wood Carvings says they started making and selling crafts as a way to empower themselves and avoid dependency on the World Food Program. On December 2012 the village’s 3 year lease expired and the village became embroiled in a process of contesting the eviction without support for relocation (Kalyesubula). The land had been leased to foreign investors to build apartments following the National Development Plan.
The map was created to amplify Women’s Market visibility and to give more time for the community to organize their future. By amplifying the resolution of their own map of the village with a Community Satellite, the state’s claim for foreign development of the land could be contested and challenge Google’s satellite images of their village. Despite the maps ability in some part to achieve these goals, the community was evicted on February 25, 2013.
The Market’s map contested state eviction and land rights through counter-mapping and the use of Community Satellites. This essay serves to illustrate the pros, cons and future implications of Community Satellites as tools for political agency in developing contexts.
Political Agency of Community Imaging
Geographic Information Systems (GIS) display geographical data in a manner, which allows people to trace patterns and reveal trends. With the advent of Digital Media, search-engine-based GIS like Google Maps have proliferated for its ability to pinpoint commercial establishments and its user-friendly interface. The service is offered for free to the public, however Google has package Google Maps as part of a cloud-based productivity suite meant to help business and governments work from anywhere on any device. The suite labeled Google Apps for Business and Google Apps for Government respectively raises questions on how governments might leverage mapping data towards land rights using Google’s products.
Google Maps oozes an aura of scientific authenticity and credibility that makes it hard to question the information it displays mainly for two reasons. First, because Google Maps’ satellite view shows a map build with photographs and as Susan Sontag suggests in the text On Photography, ‘photographic elements seem to be miniature pieces of reality anyone can make” (Sontag).
The second reason is Google’s emphasis on data collection. The company’s mission is to organize the world’s information and make it universally accessible. In “Ten things we know to be true” they acknowledge data collection is a monumental task. They state that researchers at Google continue looking into ways of providing all the world’s information to people seeking answers; they are working hard to consistently incorporate information that was not readily accessible before (“Ten Things We Know to Be True – Company – Google”). But the information made available is shaped by the Google’s intended commercial goals. Google’s position is that they are a business first. Two of their revenue sources are the sale of highly targeted text ads displayed along the searched query and offering their solutions Google Apps for Business and Google Apps for Government to companies around the world and some government agencies.

Jack Schulze notes on his article Pinpoint, “Google Maps offers live, shifting representations of a complex interplay between utility and constantly changing contexts, content and commercial ambitions in one of the world’s fastest growing, most lucrative markets” (Schulze).
If the core interests of Google are a company’s commercial ambitions and government’s secure data control, it is clear whose interests are taking priority in shaping how Google presents its mapping imagery. How can mapping be used to represent communities without viable political or commercial resources in comparison to state and large commercial interests?
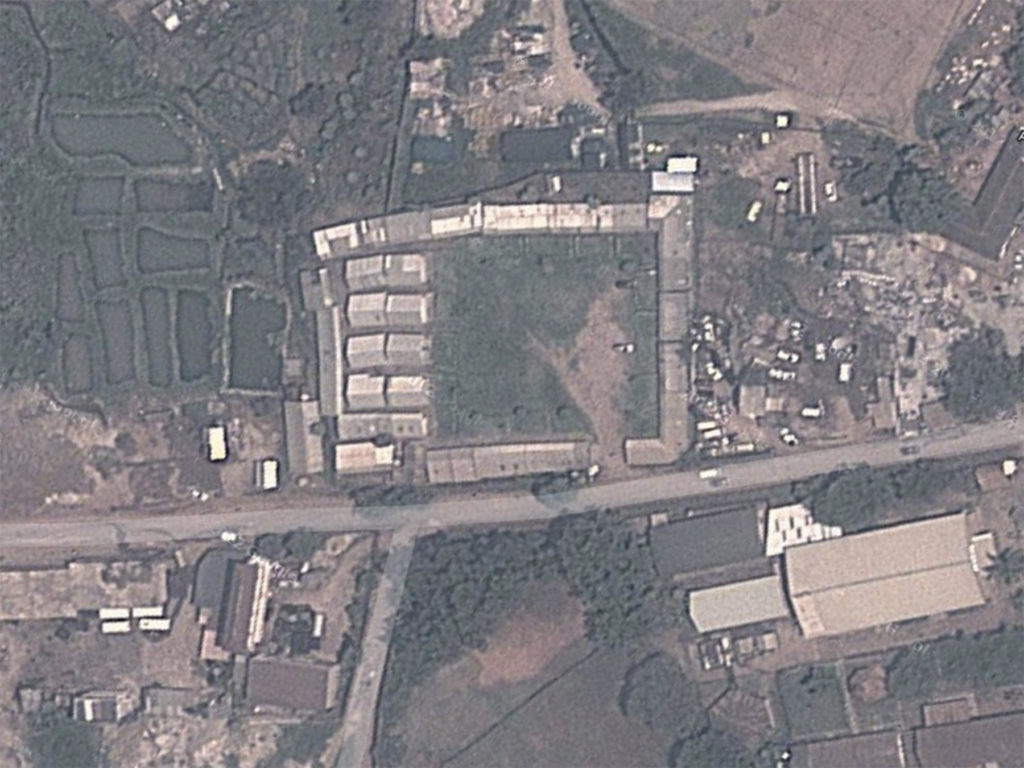
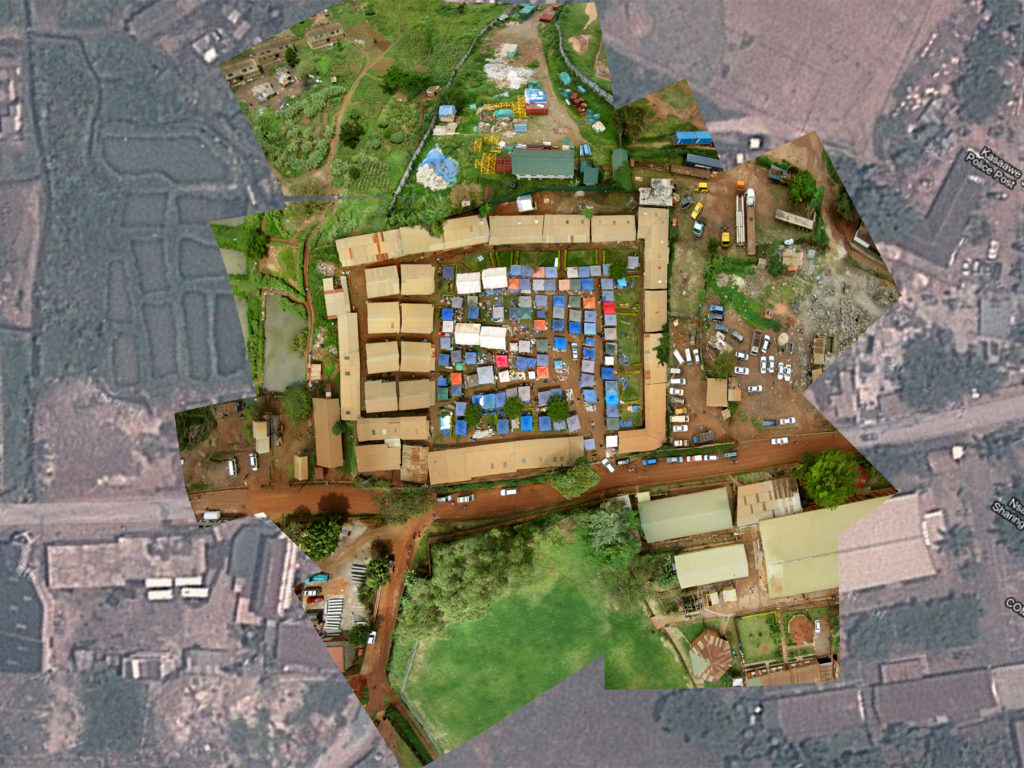
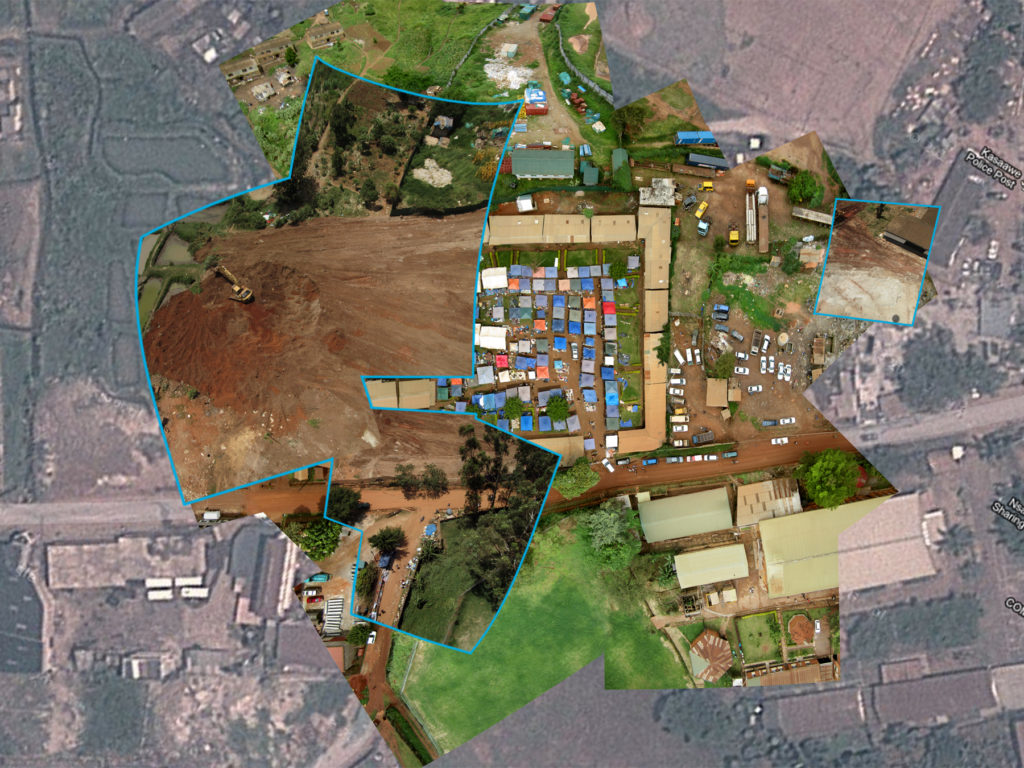
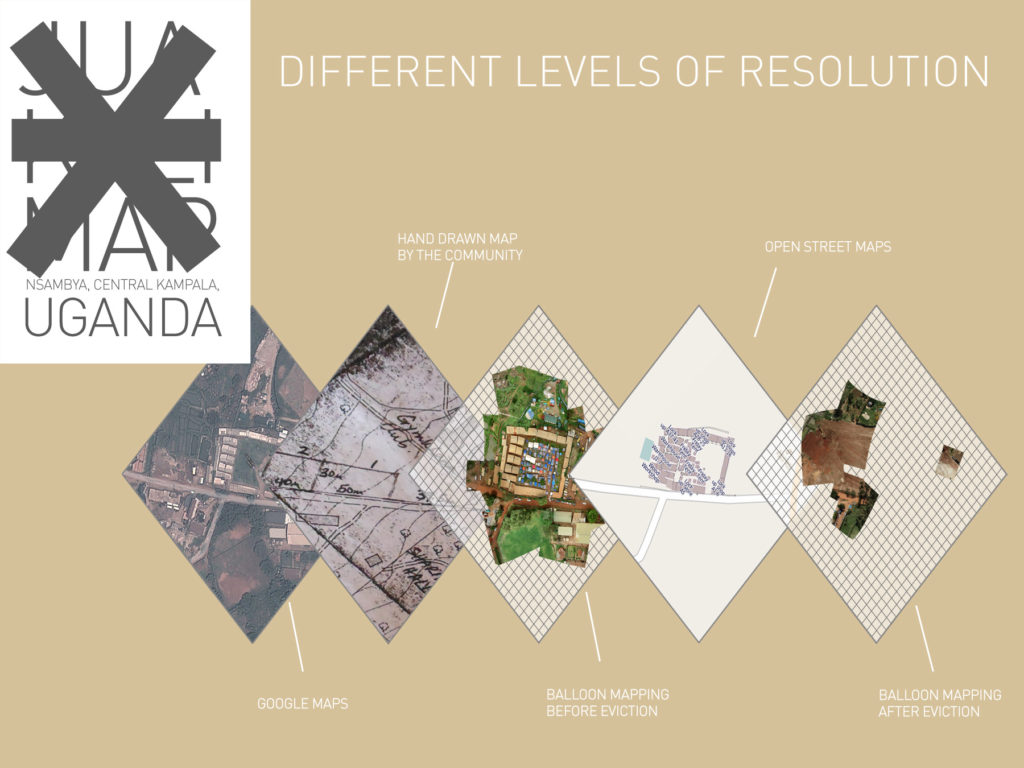
When I met the The Women’s Market in October 2012, they were using mapping to track evictions that were taking place around them. The intricate and detailed hand-drawn map established the boundaries of their space. The thing that they were unable to include on their map due to its hand-drawn nature was the overall 800-person workforce in the market. Similarly, when seeking to use Google Map’s satellite images we realized it showed the market when it was empty. This is when using photographic evidence and Community Satellites became key.
Community Satellites, an open-source tool developed by Grassroots Mapping (now The Public Laboratory) invert the traditional power structure of state cartography. Community Satellites’ are built by combining helium balloons, household items and inexpensive digital cameras in order to achieve high-resolution aerial photography. By lowering the access cost of aerial photography, Community Satellites, an updated version of Indigenous Mapping, can be used by communities to question the supposedly objective nature of mapping and how state and commercial interest represent them.
Bernard Nietschmann, an advocate of Indigenous Mapping, in the text “Defending the Miskito Reefs with Maps and GPS: Mapping With Sail, Scuba, and Satellite” suggests that Indigenous Mapping “…helps authenticate traditional territory, calls into questions a central government’s assertion that indigenous people don’t have a land or a sea territory, and serves internationally to promote greater self-determination” (Nietschmann). Thus Indigenous Mapping, and its updated version, Community Satellites, can help to apply social force to state governments and big companies by giving communities the power to create maps with the information they are interested in displaying.
I proposed to them using a Community Satellite because a photographic map of the village could present their space in a more favorable way and the need to stay in the location they were already occupying. The Community Satellite allowed The Women’s Market secure evidence of their boundaries, craft-making activities and commercial importance in the location to contest state eviction without relocation.
Using the Public Lab’s Balloon Mapping kit, the Women’s Market and I wanted to combine the bird’s-eye view of aerial mapping with the bottom-up approach of community stories to enable multiple narratives of place to be visible and relevant. By amplifying the resolution of their map with a Community Satellite, we could question the state claims on The Women’s Market importance and generate an alternative representation un-reliant on a large commercial actor like Google to represent the community’s voice.
To question the state claims, the Women’s Market used the map to acquire a court injunction stopping the eviction until further investigation. Also, they sent letters to several different government agencies with letters pleading their case and showing they had indeed developed the land. They had a thriving market with a considerate work force, and the map showed the different activities on the site: from women making crafts to tourist shopping. The map proved to the Ministry of Tourism that their diverse activities played an important role in the tourism industry. The Ministry of Tourism sent a team to evaluate their work and wrote a letter to the Ministry of Land pleading their case. This stalled the eviction, bureaucratically, for two extra weeks.
To subvert Google Maps’ representation of the space, we release the photographic map to the public domain through an open-source GIS, OpenStreetMaps. Users of Google Maps are not able to directly shape the maps it displays. But Google Maps sometimes takes information from OpenStreetMaps of areas they are not able to constantly update in an attempt to make the most recent information on an area available.
In the end, the community was evicted on February 25, 2013. We decided to do a second map in hopes of recording the progress of the clearing. We also wanted to document how the lack of support in relocation had lead to the displacement of the previously flourishing market to a side street. The new map shows the stark contrast of the market before-and-after the eviction. Using this new map, Juakali Handcraft Village wanted to advocate their case and get support to relocate to a better location.
The Craft Market’s agency and the aerial mapping managed to stall the eviction through different structures. It stalled the eviction legally for a month when the community, using the map, acquire a court injunction. Also, they sent letters to several different government agencies. The map proved to the Ministry of Tourism that they played an important role in the tourism industry. The Ministry of Tourism sent a team to evaluate their work and wrote a letter to the Ministry of Land pleading their case. This stalled the eviction, bureaucratically, for two extra weeks.
Pros and Cons
Community Satellite is a good tool for political agency, especially in the case of land rights. Through photographs, Juakali build a map that served to stall eviction by the state for a few months and provided an alternative to how foreign companies like Google are representing the village.
The maps that can be generated using the tool become ‘photographic elements [that] seem to be miniature pieces of reality anyone can make” (Sontag). Also because the proximity of the Community Satellite can be controlled, the resolution of said photographs is higher than the resolution Google’s satellites can provide, thus Community Satellites are capable of capturing the intricate details of the space. Thus Community Satellites appeal to representational values that are hard to dismiss by large companies and state governments. Photography provides a viable vision of the space and ultimately stalled eviction.
While the photographic map made by Community Satellite provided an alternative to how foreign companies like Google are representing the village and how state government understand the space, it provided no place for their initial hand-drawn map in the discourse.
Also it relied on me financially to make the map happen. The harsh reality of the Community Satellite in Uganda is that for it to serve as a tool of political agency and to stall eviction it needs of foreign resources to support it.
A Balloon Mapping kit sold by the Public Laboratory cost around $100 dollars, which translates to 259,067 UGX. Following the Ugandan National Household Survey of 2009/2010 (“Uganda National Household Survey 2009/2010”) the overall, country-wide-average for monthly household income was 303,707 Ugandan Shillings, which translate into $116.62. But in close inspection, a male-headed household in rural Northern Uganda makes 117,200 Ugandan Shillings a month, which translates into $45.
This means that Community Satellites are not excessively expensive for a group of Ugandans to afford if they follow a SACCO like model of saving money. SACCO (Savings and Credit Co-operative) is a credit union model specific to Africa where members with a common tie agree to save their money together and make loans at a reasonable rate to each other. The members own, govern and manage the SACCO, giving them the liberty of deciding how their money is used. SACCO members usually put forward around 5,000 UGX a week and at the end of the month they award the loan to one member. Considering that the cost to sell in the courtyard of the market was 5,000 UGX a week, it seems reasonable for the Juakali Handcraft Village Committee to be able to ask and put away half of that for each member. This model is great for saving money but unreliable when there is the urgent need for a map eviction is eminent.
The kit provides a low entry point into aerial photography, but does not provide a camera and the real problem is the cost of helium. Prices for refined helium have quadrupled from $40 per thousand cubic feet in 2000 to $160 in 2012 mainly because the United States is selling its stockpile left over from the Cold War(Rampell). An 8.5 cubic meter tank (the smallest sold) in Uganda goes for 2,860,000 UGX plus 500,000 UGX deposit for the metal cylinder, resulting in an initial investment of $1,294.80. Each cylinder holds enough helium for 7 balloon mapping sessions and the cylinder could be used for 6 months. Using a kite was not an option because of wind conditions. Renting a small plane to fly over the area and take pictures instead costs around $90 per hour, which seems feasible.
In the case of Juakali, cost efficiency was neither a means nor an end. My intuition was that by going through the process of mapping, it would assist the village in articulating their aspirations for the market. Also the members of Juakali and I could have control over exactly what got photographed and to what resolution by winding and unwinding the balloon closer to the ground. If already in stock, the balloon takes little time to set up, which meant that in the unforeseen event of an eviction near the market, we could spring the balloon near the site and photograph the event.
Considering that after the eviction nothing was physically left of their presence, thanks to the Community Satellite we where able to capture for posterity and alternative view of the what development in Uganda could look like as defined by the community.
First attempt at a didactic image of the steps/ representations built of the space.
Corporate Level: The first layer is the Google maps image and represents the market with only the aluminum stalls. Google, as a foreign global institution, is shaping our perception of the actual size and impact of the market. Google is making claims on the geographic boundaries of the space by naming buildings and marking roads. The ideas behind the credibility of photographic representations and the prestige of the institution render this map as the most important source to what was physically in the space.
Community Level: The second layer is the hand drawn map done by the community. By being the experts on the ground, they mark on the map what was relevant to them.
Collaborative Counter Level: Through a workshop of balloon mapping, The Craft Market and I amplified the resolution of their hand-drawn map to level the playing field.
Counter-Corporate Level: Feeding the map back into an open source GIS, the community was able to shape the way they were being represented and made their own boundary claims online.
Erasure Level: Stripping the land suggests the presence of the ‘new owner’ and the new owner’s workers who are making preparations for a new phase in that space. Dismantling the stalls behind hidden tall metal fences hints to the erasure of the previous occupants. Nothing is left of their presence, their memories, or of how they had impacted that space.